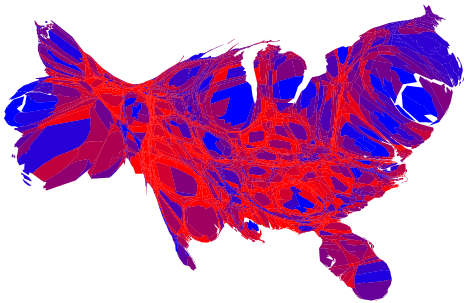
Via Crooked Timber. Who got it from here. It's three guys from the University of Michigan and once they plot out their data and everything they reach this conclusion:
If one were to summarize simply, it appears that the election's winner won by a slim majority of people in counties that -- as counties -- were rather ambivalent about their decision. He was opposed by a nearly (but not quite) equal number of people a considerable fraction of whom live in counties that were very certain of their support for his opponent.
So there you have it: statistical evidence of the liberal coccoon. Six million people who've never even seen a Republican. If I was a conservablogger I'd be all over this. But I'm not--so down to sleep I go.
By the way--Blogger stinks with fonts. And USC lost and Utah won. The BCS dies this year, I swear it.
UPDATE: USC didn't actually lose--the hey? I swear ESPN said that. The BCS dies anyway.
No comments:
Post a Comment